Kara Baskin | Slice of MIT
July 14, 2020
Where could another Covid-19 spike happen? During the next major hurricane, will residents have access to food and appropriate shelter?
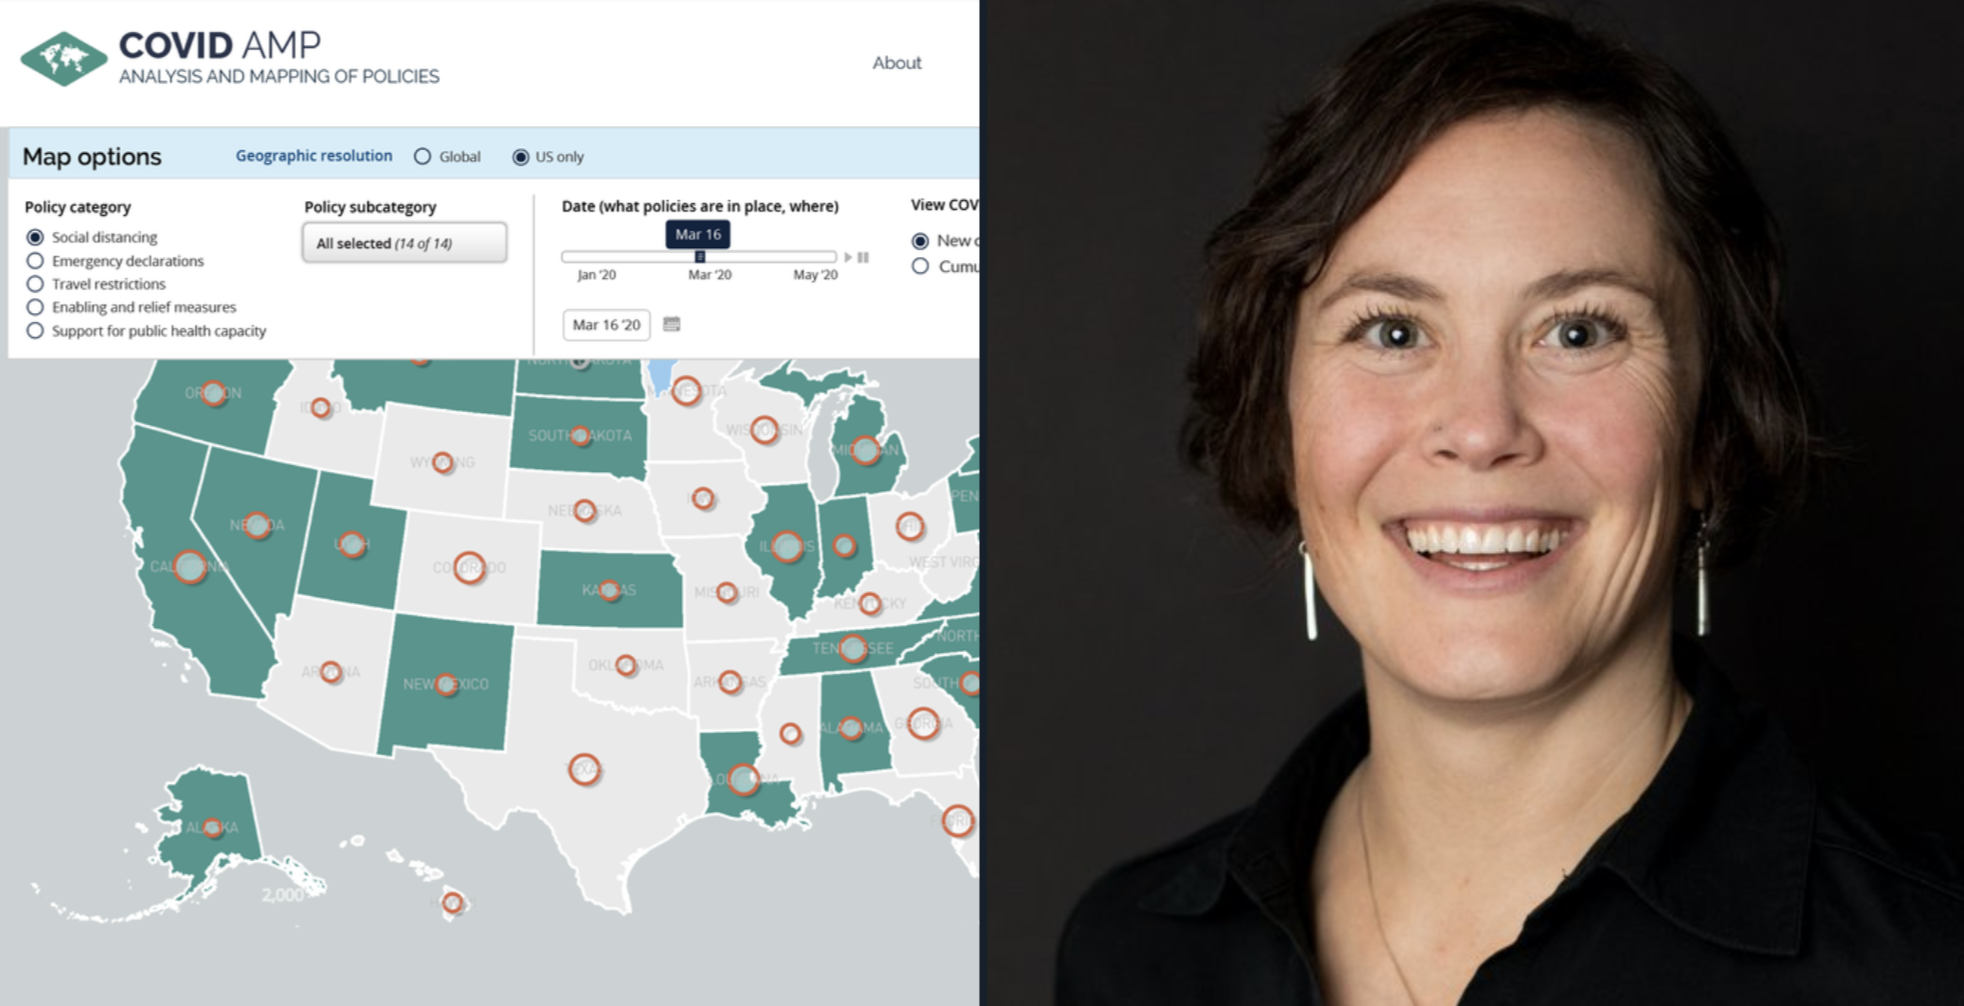
Ellie Graeden PhD ’11 answers questions like these as founder and CEO of Talus Analytics, a Colorado-based research and consulting firm. She’s a scientific interpreter, deciphering natural-disaster and public-health data for decision makers who must act sensibly—and quickly.
Talus is currently focused on modeling the spread of Covid-19 to guide response efforts, working closely with academic and research partners and the US Centers for Disease Control and Prevention in a range of efforts, several of which are publicly available.“Often, those kinds of data aren’t communicated in a way that’s immediately useful,” she explains. “We translate the data and the modeling results to inform practical decisions that need to get made on a day-in, day-out basis.”
COVID Local is a data-driven decision framework that helps policymakers determine when and how to reopen during each phase. A dashboard uses clear metrics to determine the parameters for each threshold. It’s a joint initiative from the Global Biological Policy Program at the Nuclear Threat Initiative (NTI), the Center for Global Development, and the Georgetown University Center for Global Health Science and Security, where Graeden is an adjunct professor.
“COVID Local is focused on getting concrete guidance in place for those local decision makers so that they have a checklist that they can work through, driven by some of the best experts in global public health, who have managed outbreaks for Ebola in 2014 and elsewhere,” she says.
A second tool, Re:Public COVID Log, is a map-based platform that tracks communities visually, providing views of hazard risk, infrastructure, and population. It was developed with support from the US Department of Homeland Security and FEMA, and it’s simple enough for a nonexpert to use.
“A lot of the current tools are very expert focused. This is targeted for use by those without hazard-specific expertise—for example, by the communications office for a mayor,” she says.
In collaboration with Georgetown University, Talus has also built a large-scale database to track the effectiveness of various mitigation policies, helping to guide policymakers who might need to close for a second wave.
“We let them know what worked the first time,” she says.
All of this might seem like a leap for a microbiologist. Graeden earned her doctorate in cell biology at MIT, where she studied brain development in zebrafish under Professor Hazel L. Sive.
“I learned how to tell scientific stories visually, which is essentially what microscopy is. You’re telling stories with pictures,” she says.
She founded her 10-person firm in 2015 to do the same with global health issues: There was plenty of data, she felt, that nobody was looking at under a microscope and bringing to light. (Fellow MIT alum Trae Wallace MBA ’10 guides Talus’s development as its head of data.)
The company first made a name for itself during Hurricane Matthew in 2016, when Talus deployed to FEMA’s National Response Coordination Center to deduce how many people would be impacted by the storm’s wrath.
Her team harnessed data from the Department of Energy, looking at real-time power outages, and merged them with inland and coastal flood modeling to determine counties that would be hit. Next, they leveraged census data to capture the total number of people affected. While all the data from each source had been previously available, the questions being asked required real-time integration of the information for the response effort.
Since then, Talus has become a go-to for government and academic partners when “integrating different types of information and doing that storytelling,” Graeden says. “Flood modelers didn’t feel comfortable pulling in energy data or outage data or coastal modeling data. It was really a data analysis and storytelling problem,” she says.
Now, she tells these number stories from her perch in Colorado, where she moved in 2015 to be farther from what she calls “power-driven” Washington. It’s also closer to northern Idaho, where she grew up. Still, she looks back fondly on her time in Cambridge, where she jogged in the Arboretum and played competitive Ultimate Frisbee off campus, practicing up to 16 hours on the weekends. She also leaves a legacy of service to the school community as the founder of MIT BioREFS (Resource for Easing Friction and Stress), a peer mentorship program within the biology department, after a friend died by suicide.
“MIT was the first place I’d ever been where the response to an idea was routinely, ‘Well, is that the right thing to do?’ Whereas prior, the response had always been, ‘Well, can it be done right?’ At MIT, it’s not ‘Can it be done?’ but ‘What is the right way to solve it?’” she says.
As for the right thing to be doing about Covid, her assessment is stark.
“In the US, we are functionally no different from where we were three months ago. We have better treatments and a better sense for what works on the treatment side, but we have no preventative measures. We have no vaccine. We have no way to prevent people from getting sick, except social distancing measures,” she warns.
She hopes for equitable distribution of an eventual vaccine, using transparent data with demographic information layered in to target vulnerable communities.
“We need to be clear-eyed about what is happening. We need to collect data with demographic details attached. Florida, for example, decided at one point not to allow its coroners to report Covid deaths, and those limitations on data release really hamstring our ability to respond in an informed way. We have to collect the data, we need to be able to analyze it, and we need to be able to integrate data so that we can make decisions on the basis of it,” she says.